Speed
Two of these take a second. One takes minutes, and it isn't us.
Every number on this page is produced by a project that ships with Neuridion, on your own Mac, when you press the button. Nothing here is a claim you have to take on trust — it is a benchmark you can run.
Your project starts in the IDE. No packaging, no signing — the window is just there.
Same start, with breakpoints, step over, values you can open, and a query log that makes an N+1 loop visible.
A real .app you can double-click. A 160-table project measured at about a second; the finished bundle was 12 MB holding a million records.
The striped part is Apple. Assembling, encrypting and signing is seconds; then the notarisation service has to look at it, and that queue is out of everyone's hands. You do this when you ship — not fifty times an afternoon.
“Nothing is compiled” — which is half true, so here is the whole of it.
A finished application is a precompiled shell — the same binary for everyone, built and signed by us once — with your project beside it as an encrypted payload. Building copies, encrypts and signs. Nothing of yours goes through a compiler, which is why the loop is instant and why a bug we fix in the runtime is fixed in every app you rebuild afterwards.
But your scripts are not interpreted line by line either. They run in JavaScriptCore — the engine inside Safari — which compiles hot code to native machine instructions while it runs. A loop that matters gets faster the second time round, without you doing anything. So: no build step, and no interpreter tax on the code that counts.
- Harbour Supply.app assembled 0.4 s
- Starting data collected — 2 tables 0.2 s
- Project encrypted into the application 0.3 s
- Icon generated at every size 0.1 s
- Signed with Developer ID, Hardened Runtime 0.6 s
- Submitted to Apple for notarisation …waiting on Apple
- Ticket stapled
- Packaged
- Done — Harbour Supply-1.0.dmg
And the server, flooded on purpose
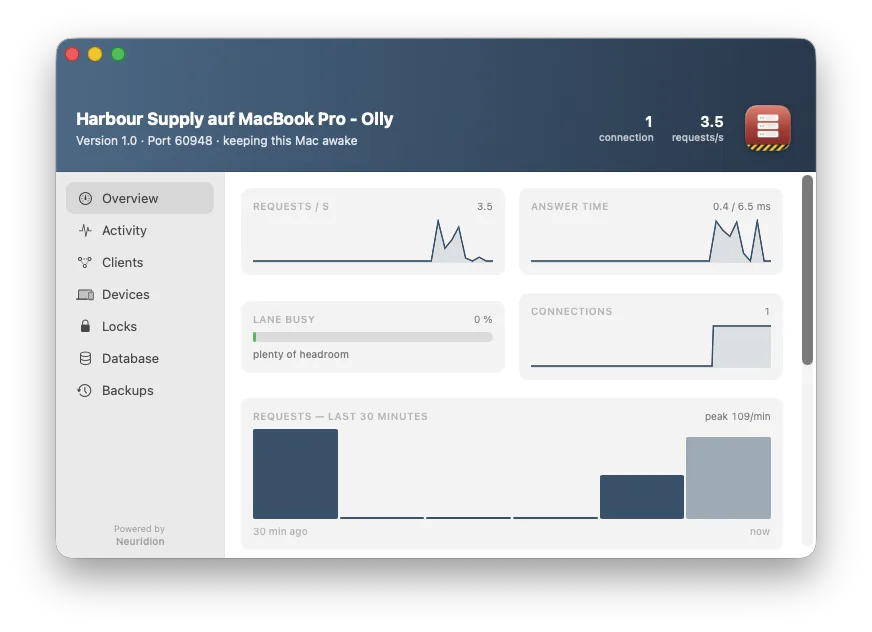
We hammered one MacBook Air (M2) with hundreds of real clients at once over Wi-Fi, no pauses between requests. A safe number to plan around is about 50 clients at once — answers well inside a tenth of a second, on a plateau near 700 requests a second, with zero errors and not one refused connection. How far it really goes depends on what you build and how hard each client works the server — a form that reads one record is not a report that scans a table. Its own time per request stays in the low single-digit milliseconds, so the rest is the network, not the machine. Pushed far past that it slows down, it does not fall over: still answering, still in order.
Don't take our word for it
The same numbers, measured — and the one that explains the whole thing.
These come out of the Benchmark project that ships with Neuridion. It is one of the two examples in the box: open it, press the button, watch it measure your own Mac. Every figure below is the median of three runs.
800 separate functions, each called once 2.3 M ops/s
the same work, the loop kept warm 48 M ops/s
21× faster, and nobody did anything. That is the honest answer to “is it interpreted?” — it starts interpreted and stops being interpreted where it matters. JavaScriptCore watches which code is actually hot and compiles that to native machine instructions while your application runs. A rule that fires once on a button click is in the top row and nobody can tell; the loop over four thousand invoice lines is in the bottom one.
| Measured | Per second | What it means |
|---|---|---|
| The language | ||
| Reading a property of an object | 73,600,000 | rechnung.betrag, over and over |
| Calling a function | 68,200,000 | your own helpers cost nothing worth measuring |
| Building text | 11,600,000 | names, addresses, a line for a report |
| Sorting an array | 5,700,000 | elements per second, in memory |
| The bridge between JavaScript and the data | ||
| Reading a field of a record | 1,036,000 | this is the number that decides whether a synchronous API can work at all |
| Writing a field of a record | 851,000 | same crossing, the other way |
| The database | ||
| Finding one record by its identifier | 727,000 | the commonest thing any application does |
| Following a relationship | 480,000 | rechnung.kunde — one hop |
| Searching an indexed field | 42,000 | the same search, with and without an index — 14× apart, which is why the schema asks |
| Searching a field with no index | 3,100 | |
| Full-text search | 6,900 | real indexed search against a plain “contains” — 6× apart, and it ranks the answers as well |
| “contains” over the same text | 1,100 | |
| Counting and summing | 6,900 | whole-table totals, done by the database, not by loading rows |